SEO success hinges on the ability to measure your website’s data and performance. That’s why SEO audits and reports are vital for online success.
Unfortunately, they’re also packed with industry terms aren’t exactly household words. Add in charts and graphs, and your typical SEO report appears pretty intimidating.
However, they’re actually pretty to read once you understand what you’re looking at. We’ll cover that here.
Important Terms in SEO Reports
First, you’ll need to understand the metrics that matter. Here’s a quick list of the jargon that you’ll find in a typical SEO report. The actual words may vary slightly by platform, but you’ll typically measure the equivalent of these metrics:
- Keyword: this refers to a word or entire search phrase that a person types into Google. It doesn’t necessarily have to be one word. In fact, an entire question or statement can comprise a single keyword.
- Intent: This describes the motivation behind a search. For example, is the searcher looking for information, or are they ready to make a purchase? Many tools (including SEMrush) ascertains user intent by analyzing web activities.
- SERP: This is an acronym for “search engine results page.” When you search for a keyword in Google, the SERP is the page that lists results.
- SERP Features (SF): Have you ever noticed a short paragraph appearing at the top of Google’s results above website listings? Or specific locations appear alongside a map before search results? These are two examples of SERP features. They help your website stand out in Google’s search results, which helps drive more traffic. SERP features are part of good SEO; you don’t have to pay extra for them.
- Traffic: This depends on the context. It typically refers to how many people visit your website. However, you may also see it used to reference how many people are visiting your website after searching for a specific keyword.
- Volume: This typically estimates how many people are searching Google for a given keyword. Obviously, ranking for keywords with higher search volume means more traffic for your website.
- Keyword difficulty (KD): This estimates how difficult it will be to rank for a specific keyword. The higher the number, the harder it will be to rank a site for that phrase.
- Updated: If you’re using an SEO audit and analytics tool that doesn’t update in real time, the updated date shows when the metrics were last updated.
Notice that we mention “estimates” frequently. SEO reports are always helpful, but they’re not always perfect. Information moves fast online, and metrics are always changing.
Viewing These SEO Metrics in Tables
Now that you know what the jargon means, let’s discuss how these metrics are applied to keywords in SEO audits and reports. We typically use SEMrush and Google Analytics to compile reports. These are the leading industry platforms for measuring a website’s performance.
SEMrush Reports
SEMrush reports can be entirely customized. We typically start with the following sections:
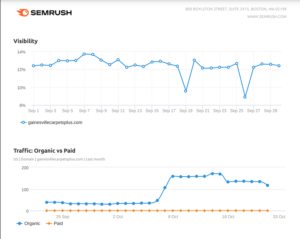
- Visibility: This shows the visibility of your website in search engines for a pre-defined set of keywords. You can change the focus keywords anytime.
- Traffic: Organic Vs. Paid: This graph shows how organic traffic (the number of visitors coming from search engine rankings) has changed over a set timeframe. The blue line represents SEO rankings. The orange line will only show data if you advertise on Google Ads.
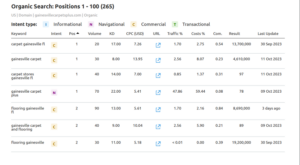
- Organic Search: Positions: these are the positions for the keywords your website ranks for. We typically list them in ascending order.
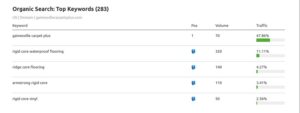
- Organic Search: Top Keywords: these are the keywords driving the most traffic to your website. These may not always be the keywords you rank in the first position for.
SEMrush reports can contain other metrics as well.
Google Analytics Reports
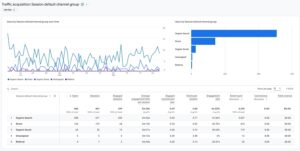
Google offers many reports on its Analytics 4 platform. We listed one of the most common reports for its combined simplicity and usefulness. The Traffic Acquisition report is broken into these sections:
- Users by Session Over Time: This shows how many user sessions occurred over a period of time set by you.
- Users by Session Default Channel Group: This graph offers a quick visual of which channel is sending the most traffic. Here’s a breakdown of each channel:
- Organic Search: this is traffic coming from search engines, including (but not limited to) Google.
- Direct: people who visited your website directly.
- Organic Social: people who found your website on a social media site. This does not include traffic driven by ads.
- Unassigned: traffic that Google couldn’t find the source for.
- Referral: visitors who found your website via a link on another website.
Below the graphs, you’ll see a table breaking down the metrics for each channel.
Custom SEO Audits for Your Phoenix Business
If you own a business in the highly competitive market that is metro Phoenix, SEO audits must be custom tailored to carefully reflect vital metrics.
Fortunately, we make this easy! Our custom SEO audits include the information that matters most to your business. Instantly discover which keywords you’re ranking for, how much traffic you’re getting, and how well your site is performing overall. Even better, we offer monthly SEO audit subscriptions for only $10 per month!